How we utilize price elasticity insights (USA)
Our award-winning BrightWrite data analytics platform has the capability to run pricing experiments to deliver insights for our partners. These insights then form the basis of tailored and personalized insurance offers for customers, to maximize conversion rates and ancillary revenue. One such experiment we ran was on the trends of price elasticity across the US, and how it varies state by state – an important distinction when making pricing decisions!
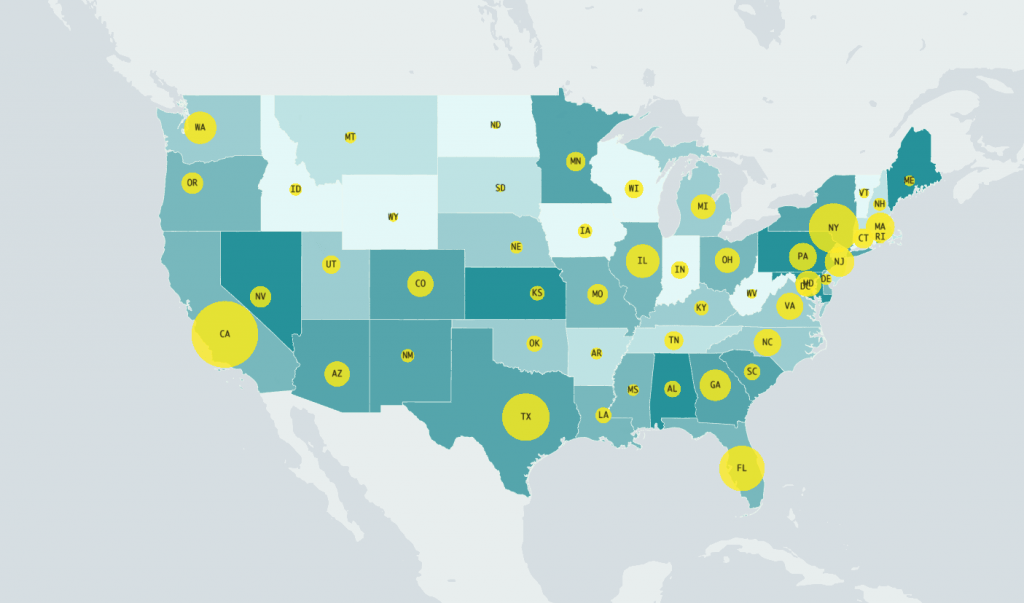
This chart shows the price elasticity for all 50 US states, as offered on our partner network. It is denoted by:
Light green: sensitive to price changes
Dark green: not sensitive to price changes
And the bubble size indicates the sales volume.
By looking at the biggest bubbles, we can identify patterns and opportunities. California and Florida are surprisingly price sensitive; whereas Texas and New York are big sellers and thus are an attractive market from a price elasticity perspective.
With these insights, we’re capitalizing on these core markets with new-to-market products that have a variable price capability. One such product is Smart Delay, a flight delay service that pays using a range of different value transfer mechanisms; and Global Doctor, a medical service for international travellers in case things go wrong.
Additionally, we’re introducing annual subscription plans in some markets, sold to loyal customers who don’t necessarily buy insurance, thereby removing fear of cannibalization for our partners.
The valuable insights offered by the BrightWrite platform allows our partners to make informed decisions when it comes to pricing and product recommendations, as demonstrated by this price elasticity experiment.